Hey, Tea Lovers! Today we will talk about Java Memory Management. Memory management is the process of the allocation & de-allocation of objects from a memory and it’s done automatically with the help of a garbage collector.
As Java programmers, we do not bother about java memory management as Java has an automatic garbage collector that works in the background to clean up unused objects and free up java memory.
However, java memory is an automatic process but it does not guarantee it. So knowing how java memory works give the advantage of writing high-performance and optimized applications that will never crash with an OutOfMemoryError. On the other hand, when you find yourself in a bad situation, you will be able to quickly find the memory leak.
This post had become so long to read, I had to break this post into separate posts. This is the first part, about the structure of JVM.
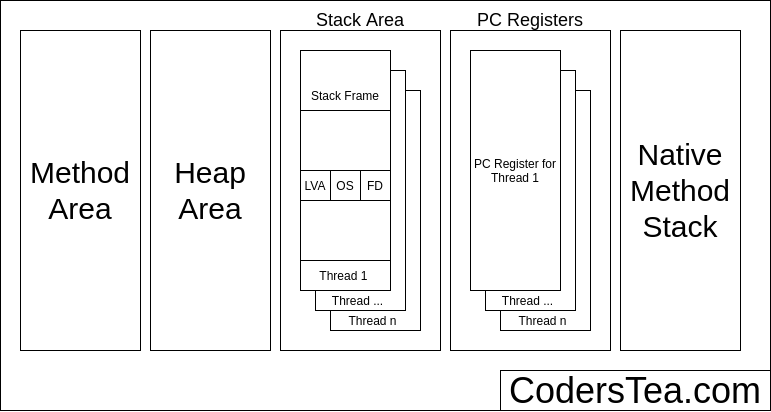
JVM Memory Structure

jvm_memory_struct
There are five types of memory in java as follows,
Method Area
- Part of the heap space & is shared among all the threads.
- There is only one method area per JVM and it is a shared resource.
- Stores all class-level information, including static variables.
Heap Area
- The heap stores the actual objects, when you use a new keyword, the JVM creates an instance for the object in a heap.
- As shown below,
StringBuilder builder = new StringBuilder();
- While the reference of that object is stored in the stack. There exists only one heap for each running JVM process. When the heap is full, then the garbage collector runs & frees the space.
- The user can control the heap if needed. It can be of fixed or dynamic size.
- It is also divided into subparts same will explain follow in the article.
Stack Area
- Each thread has a separate stack.
- The variables stored on the stack have certain visibility, called scope.
- It contains references to heap objects. It also holds the value itself rather than a reference to an object from the heap.
- A stack frame is a data structure that contains the thread, Each frame contains its Local Variable Array (LVA), Operand Stack (OS), and Frame Data (FD). The sizes of LVA, OS, and FD are determined at compile time.
Native Method Stack
- Also called C stack.
- Not written in Java language.
- Java Native Interface (JNI) calls the native stack. The performance of the native stack depends on the OS.
PC Registers
- Each thread has a Program Counter register associated with it.
- Stores the return address of the JVM instructions currently being executed.
Heap Area
HeapAreaMemoryDistibution
- Old Generation Space
- Young Generation Space
- Eden space
- Survivor Space 1
- Survivor Space 0
Which works as follows,
- When an object is created It is first allocated to Eden space Because the Eden space is not that big & gets full quite fast. The garbage collector runs on the Eden space and clears all non-reference objects.
- Once an object survives a garbage collecting process, it gets moved into a survivor space 0. The second time the garbage collector runs into the Eden space, it moves all surviving objects from Eden & everything that is currently in survivor space 0 is moved into survivor space 1 space.
- If an object survives for X rounds of the garbage collector (X depends on the JVM implementation), it is most likely that it will survive forever, and it gets moved into the Old space.
MetaSpace
- Stores the metadata about your loaded classes in the JVM.
- PermGen is an abbreviation for Permanent Generation and it’s a special heap space that is separate from the main Java heap where JVM keeps track of metadata of the classes which have been loaded.
- In Java 8 Perm Gen memory has been renamed to Metaspace
Permanent Generation (Replaced by Metaspace since Java 8)
- Permanent Generation or “Perm Gen” contains the application metadata required by the JVM to describe the classes and methods used in the application.
- Populated by JVM at runtime based on the classes used by the application. Perm Gen also contains Java SE library classes and methods.
- Perm Gen objects are garbage collected in a full garbage collection.
- With Java 8, there is no Perm Gen, which means there is no more “java.lang.OutOfMemoryError: PermGen” space problems. Unlike Perm Gen which resides in the Java heap, Metaspace is not part of the heap.
- The theme behind the Metaspace is that the lifetime of classes and their metadata matches the lifetime of the classloaders. That is, as long as the classloader is alive, the metadata remains alive in the Metaspace and can’t be freed.
Reference Types
In the Java programming language, we have different types of references: strong, weak, soft, and phantom references. The difference between the types of references is that the objects on the heap they refer to are eligible for garbage collecting under different criteria.
Strong Reference
- These are the most popular reference type.
- The StringBuilder holds a strong reference to an object from the heap.
- The object on the heap is not garbage collected while there is a strong reference pointing to it, or if it is strongly reachable through a chain of strong references.
Weak Reference
- A weak reference to an object from the heap is most likely to not survive after the next garbage collector process.
- A weak reference is created as follows:
WeakReference<StringBuilder> reference =
new WeakReference<>(new StringBuilder());
- Weak references use for caching scenarios. Imagine that you retrieve some data, and you want it to be stored in memory as well, the same data could be requested again.
- On the other hand, you are not sure when, or if, this data will be requested again. So you can keep a weak reference to it, and in case the garbage collector runs, it could be that it destroys your object on the heap. Therefore, after a while, if you want to retrieve the object you refer to, you might suddenly get back a
nullvalue. - Collection WeakHashMap<K, V> If we open the WeakHashMap class in the Java API, we see that its entries extend the WeakReference class and use its ref field as the map’s key:
private static class Entry<K,V>
extends WeakReference<Object> implements Map.Entry<K,V> {}
- Once a key from the WeakHashMap is garbage collected, the entire entry is removed from the map.
Soft Reference
- Used for more memory-sensitive scenarios since those are going to be garbage collected only when your application is running low on memory.
- Therefore, as long as there is no critical need to free up some space, the garbage collector will not touch softly reachable objects.
- Java guarantees that all soft-referenced objects are cleaned up before it throws an
OutOfMemoryError. - This is what Java Doc says about it,
“All soft references to softly-reachable objects are guaranteed to have been cleared before the virtual machine throws an OutOfMemoryError.”
A soft reference is created as follows:
SoftReference<StringBuilder> reference =
new SoftReference<>(new StringBuilder());
Phantom Reference
- This reference is used to schedule post-mortem cleanup actions since we know for sure that objects are no longer alive. Used only with a reference queue, since the
.get()method of such references will always returnnull. - Phantom Reference is considered over finalizers.
To be Continued…
As I said, I had to break the post into multiple parts. You can see the second part of this is the Garbage Collector and " Monitor Your Java Memory with these Tools".
Knowing how memory allocation & deallocation & how to work, gives an advantage in writing good and optimized code in terms of memory Usage & tuning up your running JVM, by providing different configurations that are the most suitable for your running application. Spotting and fixing memory leaks is just an easy thing to do if using the right tools.
Please find another post on java here. See you in the next post.
HAKUNA MATATA!!!