
Hey Tea lovers! Today, we will talk about Java memory monitoring tools. You will need them when you want to see how well or worst your code is performing, or if you don’t know what’s going on in there.
I have added not only the information about them but also videos showing how to use them in brief. It is the continuation of the post series This is the continuation of the post series “Get Ready to Deep Dive Java Memory Management”.
Monitoring memory use and GC activity give us a real-time update as to what happens on each event in the application. so it is better if we monitor the application according to applying the fix to improve performance.
jstat
- jstat utility provides information about the performance and resource consumption of running java applications.
- Using the jstat command with the gc option & java application PID to find out the JVM Heap Memory usage.
<JAVA_HOME>/bin/jstat –gc <JAVA_PID>

jstat
S0CCurrent survivor space 0 capacity (KB)S1CCurrent survivor space 1 capacity (KB)S0USurvivor space 0 utilization (KB)S1USurvivor space 1 utilization (KB)ECCurrent Eden space capacity (KB)EUEden space utilization (KB)OCCurrent old space capacity (KB)OUOld space utilization (KB)MCMetaspace capacity (KB)MUMetaspace utilization (KB)CCSCCompressed class space capacity (KB)CCSUCompressed class space used (KB)YGCNumber of young generation garbage collector eventsYGCTYoung generation garbage collector timeFGCNumber of full GC eventsFGCTFull garbage collector timeGCTTotal garbage collector timejstat command options
jmap
- The jmap utility prints the memory-related statistics for a running VM or core file.
- jmap utility for enhanced diagnostics and reduced performance overhead.
–h option will provide a jmap related to all available options.
<JAVA_HOME>/bin/jmap –h
jcmd
- The jcmd utility is used to send diagnostic command requests to the JVM, where these requests are useful for controlling, troubleshooting, and diagnosing JVM and Java applications.
- It must be used on the same machine where the JVM is running, and have the same effective user and group identifiers that were used to launch the JVM.
- But jcmd is the recommended tool to use.
<JAVA_HOME>/bin/jcmd
jhat
- The jhat tool provides a convenient browser base easy-to-use Heap Analysis Tool (HAT).
- The tool parses a heap dump in binary format (for example, a heap dump produced by jcmd).
We can analyze heap dump using jhat with the following command
jhat <HPROF_FILE>
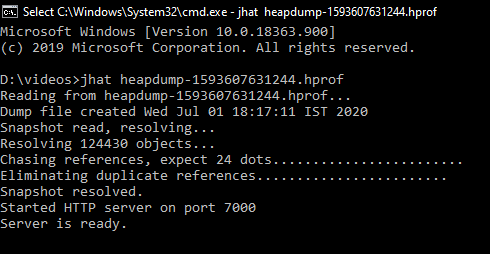
jhat
This command reads the .hprof file and starts a server on port 7000. which can view on the browser as follows
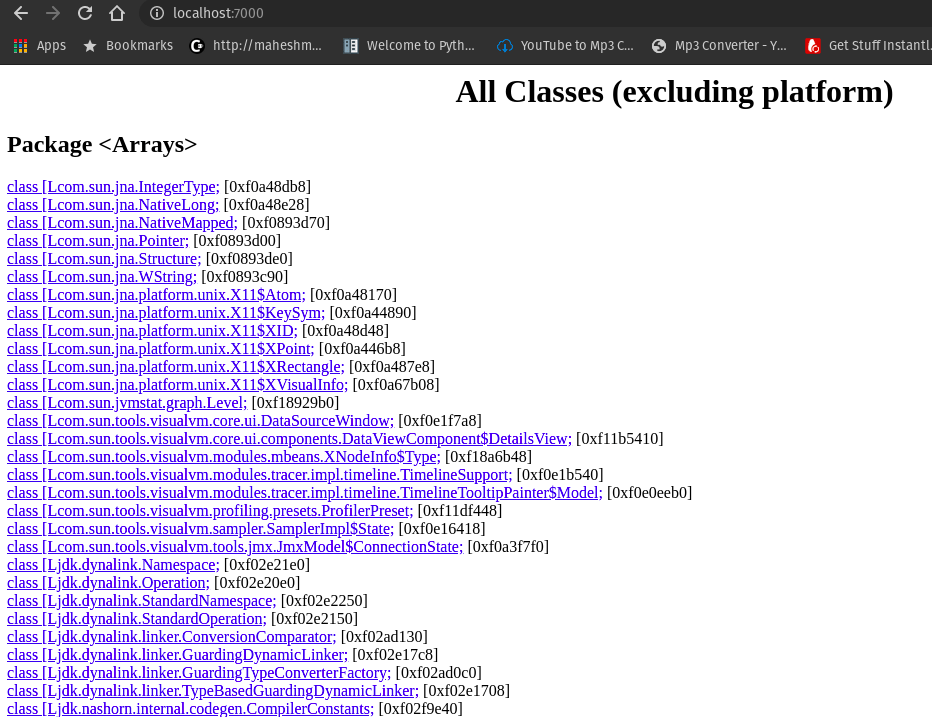
Jhat_server_report
VisualVM
- It’s easy to use, also it can extend through the use of plugins.
- VisualVM allows us to get detailed information about Java applications while they are running on a JVM and it can be in a local or a remote system also possible to save and capture the data about the JVM software and save data to the local system.
- VisualVM can do CPU sampling, and memory sampling, run garbage collectors, analyze heap errors, take snapshots, and more.
Jconsole
- It is a graphical monitoring tool to monitor JVM and Java applications both on a local or remote machine.
- JConsole uses the underlying features of JVM to provide information on the performance and resource consumption of applications running on the Java platform using Java Management Extension (JMX) technology.
- JConsole comes as part of the Java Development Kit (JDK) and the graphical console can be started using the “jconsole” command.
Memory Analyzer (MAT)
- The Eclipse Memory Analyzer is a fast and feature-rich graphical Java heap analyzer that helps you find memory leaks and reduce memory consumption.
- Download MAT from the eclipse website.
Graphical tools like visualvm, jconsole & MAT are too much self-explanatory & just start using that monitoring tool you will easily start working & understanding all tools on it.
Conclusion
That’s it for this post. We looked at multiple JVM monitoring tools. And also how to use them.
Please look at other posts in the series of JVM, " Get Ready to Deep Dive Java Memory Management: Structure of JVM" and " Get Ready to Deep Dive Java Memory Management: Garbage Collector".
I hope you liked the post. I tried to simplify things. If I had missed something please feel free to suggest it to me in the comment section. If you are still confused about the JVM, I would say please see my post series on JVM “Get Ready to Deep Dive Java Memory Management”. Please see them in the following order.
- Structure of JVM
- Garbage Collector
- Monitor Your Java Memory with these Tools
- A Day in the Life of Java Code in JVM
Hope you liked the post. See you in another post. The code can be found on GitHub
HAKUNA MATATA!!!